Analysing and studying size distributions has been important to population ecology and beyond for a long time. Empirical size distributions give important clues about current size structure of a given population and often even allow conclusions about the prevailing ecological processes. Negative exponential stem-diameter distributions are, for example, often associated with forests that are exposed to some level of disturbance and bell-shaped stem-diameter distributions can often be found in forest plantations. Therefore computing size distributions is often one of the first data-exploration tasks in ecological studies as well as in studies related to forest management. Other important contexts include:
- Sustainability of timber resources in small-scaled forest ownership,
- Silvicultural controlling,
- Decision support for forest management,
- Training and education,
- Maintaining a certain forest structure for recreational forests,
- Important starting point for analyses in point process statistics.
Empirical size distributions can be produced using histograms and bar plots. These approximate the probability density function, which can be modelled using for example the Weibull distribution model but also the beta, gamma or normal distributions. These are parametric models and there is also the possibility to produce non-parametric trend curves based on kernels. In that case no particular model assumptions are made and applying non-parametric trend curves is a good strategy for initial data exploration to prepare the selection of suitable parametric models.
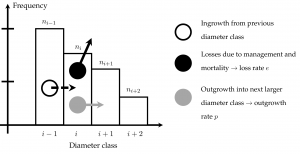
All of these methods and models have in common that they provide static information about size distributions. However, size distributions are dynamic and we are often interested in how these size distributions change with time. Of course, it is possible to model populations bottom-up at the level of individuals and then to summarise each simulation step by size distributions. Often the dynamics of the size distribution itself is of interest, researchers and stakeholders are, for example, interested in the demographic processes of certain size variables. This research approach is then closely related to other demographic studies, e.g. in animal or human populations. Typical processes involved in a dynamic size distribution are shown in the schematic graph below.
Back in the early 2000s silviculturists in the UK were very interested in these dynamic size distributions for deriving thinning guides for Continuous Cover woodlands. I remember well that I first started to discuss them in greater detail with Hubert Sterba (BOKU University, Vienna), when he first visitied me at Bangor University in 2002. In 2012 I had the opportunity to exchange views with Jean-Philippe Schütz (ETH, Zürich) whilst working in Switzerland.
In Schütz and Pommerening (2013) we used such a demographic approach to model the equilibrium conditions for a Douglas fir single-tree selection system in North Wales. The equilibrium conditions were identified in this work to inform and guide forest management. The Douglas-fir plots in Artist’s Wood (Gwydyr Forest) in North Wales have always been my favourites during my time at Bangor University and Jean-Philippe and I intended to provide evidence that single tree selection systems are possible with Douglas fir. The modelling approach was based on Schütz (2006). Brzeziecki et al. (2016) refined this approach and applied it to natural stands in Bialowieza Forest, where no forest management takes place. Here our research objective was to model equilibrium size distributions for the main tree species, in order to find out about future species composition trends as a contribution to current discussions about this important virgin forest.
The modelling approach is simple and effective. As an important component it is (1) necessary to model the outgrowth rate [latex]p_i[/latex] for each diameter class [latex]i[/latex]. This is a function of (2) size-dependent absolute growth rate [latex]g[/latex], which needs to be modelled in the next step. Finally (3) size-dependent mortality rate [latex]l[/latex] has to be determined.
Using these “ingredients” the number of trees expected at steady state can be calculated for every size class starting from a known value of [latex]n_{min}[/latex]:
[latex]n_{i + 1} = (1 – l_i) \cdot n_i \cdot p_i / ((1 – l_{i + 1}) \cdot p_{i +1} + l_{i + 1}) [/latex]
Here [latex]i = 1[/latex] and [latex]n_i = n_{min}[/latex]. Using such a dynamic size-class model many questions in population ecology and forest management can be answered.
There have been many alternative models such as the [latex]q[/latex]-factor model and its derivatives (see for example Cancino and Gadow, 2002), but they have been found to be too inflexible and not based on real, observed growth and mortality processes.
Literature
Brzeziecki, B., Pommerening, A., Miścicki, S., Drozdowski, S. and Żybura, H., 2016. A common lack of demographic equilibrium among tree species in Białowieża National Park (NE Poland): evidence from long-term plots. Journal of Vegetation Science 27, 460-469.
Cancino, J. and Gadow, K. v., 2002. Stem number guide curves for uneven-aged forests development and limitations. In: Gadow, K. v., Nagel, J. and Saborowski, J. (eds.), 2002. Continuous cover forestry. Assessment, analysis scenario. Kluwer Academic Publishers. Dordrecht, pp. 163-174.
Schütz, J.P., 2006. Modelling the demographic sustainability of pure beech plenter forests in eastern Germany. Annals of Forest Science 63, 93-100.
Schütz, J.P. and Pommerening, A., 2013. Can Douglas fir (Pseudotsuga menziesii (Mirb.) Franco) sustainably grow in complex forest structures? Forest Ecology and Management. 303, 175-183.
