Reconstruction is commonly understood as the process and the result of re-establishing something that (at least partially) does not exist any longer or of re-establishing the unknown. There are a range of established reconstruction techniques for example in archaeology, in forensics (e.g. face recognition), in medicine (e.g. implants) and computing (data reconstruction). Also statistical imputation, i.e. the process of estimating missing observations and spatial interpolation in geostatistics are related to reconstruction. Without doubt reconstruction is a fascinating research field with many different applications.
Another important, more ecological application is the reconstruction of spatial forest structure. All data, that are collected in forest ecosystems, have a temporal as well as a spatial dimensions. The properties of the whole forest ecosystem, e.g. wood production, habitat and recreational values, to a large degree depend on the underlying ecosystem structure, particularly on its microstructure. This microstructure is typically shaped by physiological and ecological interactions, but the microstructure also influences interactions. These structure-property relationships play a crucial role in providing ecosystem goods and services and in the maintenance of biodiversity. Usually data related to spatial forest structure are available only on a sample basis but subsequent research requires full information which then needs to be reconstructed.
Reconstruction can even be employed for habitat modelling: Imagine a set of summary statistics that well describe requirements of a certain, endangered animal species. These can then be used to modify an existing landscape at the computer to meet these requirements. In considering this option, we have actually moved on from reconstruction to construction, because an active change of landscape structure is modelled. Bäuerle and Nothdurft (2011) used spatial reconstruction to model habitat trees.
Another important purpose of reconstruction is the testing of competing summary characteristics. There are usually a number of statistics describing the same aspect of spatial forest structure or of a certain material. Which one is better, which one should be used in a given analysis? One way of shedding light into this is by reversing the analysis. The competing summary characteristics are used in separate simulations for reconstructing the original data from the results provided by these summary characteristics. This synthesis of a given analysis is nothing else than reconstruction and is applied a lot in materials science.
So how does it work?
Well, it turns out (re)construction is not difficult at all. First you need one or more summary characteristics describing the structure you intend to reconstruct. This can be a simple index based on a mean, it can be a histogram or a function. You can also choose a number of different summary characteristics.
Then you select a stochastic optimisation method. For this other researchers and I have successfully used the simulated-annealing method. This method was first developed in physics, it relates to thermodynamics, particularly to how the energy state of for example metals change when they anneal. The reconstruction algorithm is based on simulated annealing. One way to start is by randomly dispersing tree locations in a given observation window. Then iteratively one of these points is randomly selected and shifted to a new random location within the observation window. For this change the summary characteristic(s) are re-calculated and compared with a target, e.g. the same summary characteristic for some ideal of a reference. If the change leads to a better approximation of the target, it is made permanent otherwise it is rejected and the old state is restored (improvements-only algorithm). In either case, this is followed by the random selection and shift of another point. This process stops when the difference between target and observed characteristic(s) becomes very small or after a certain number of iterations (Torquato, 2002).
In previous publications I employed this method to reconstruct the structure of a whole forest stand from sample data by interpolating the unmeasured structure between the sample plots (Pommerening and Stoyan (2008). This even let to the astonishing result that in some cases certain summary characteristics were better estimated from the reconstruction than from the sample although no additional information was added. Nothdurft et al. (2010) in fact corrected a biased sampling design through spatial reconstruction. Together with Estonian colleagues we also used reconstruction for simulating off-plot edge correction buffers (Lilleleht et al., 2014). It is also possible to include existing, measured objects in the reconstruction through conditional simulation (Pommerening and Stoyan, 2008).
On my website pommerening.org you can find example code in R and C++ for construction, where you can essentially model a spatial point pattern that leads to a certain pre-set value of the aggregation index by Clark and Evans. Along similar lines it is also possible to set a certain species mingling index (see one of my previous blogs) for an existing point pattern and then to swap pairs of trees of different species. Here the point locations remain the same, only the species marks are re-allocated (see below for some results). Applications to remote-sensing and other image data are also known. There is no limit really to anybody’s resourcefulness to invent new ways of spatial reconstruction.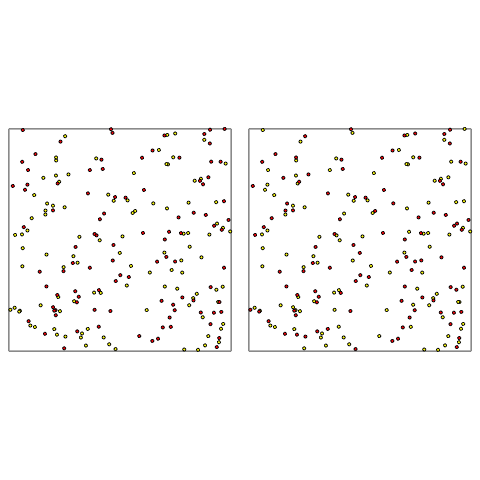 Example of species mingling construction: A random point pattern was simulated using a Poisson process in a window of 100 x 100 m. The two species (red and yellow were randomly assigned to the points with a probability of 0.5, left). Through construction the species dispersal was optimised to achieve a mingling index J of -0.20, where among the four nearest neighbours heterospecific points attract each other (right). Note that the point locations have remained the same.
Interested? Any questions? Don’t hesitate to get in touch.
Literature
Bäuerle, H. and Nothdurft, A., 2011. Spatial modeling of habitat trees based on line transect sampling and point pattern reconstruction. Canadian Journal of Forest Research 41, 715-727.
Lilleleht, A., Sims, A. and Pommerening, A., 2014. Spatial forest structure reconstruction as a strategy for mitigating edge-bias in circular monitoring plots. Forest Ecology and Management 316, 47-53.
Nothdurft, A., Saborowski, J, Nuske R. S. and Stoyan, D., 2010. Density estimation on k-tree sampling and point pattern reconstruction. Canadian Journal of Forest Research 40, 953-967.
Pommerening, A. and Stoyan, D., 2008. Reconstructing spatial tree point patterns from nearest neighbour summary statistics measured in small subwindows. Canadian Journal of Forest Research 38, 1110–1122.
Torquato, S., 2002. Random heterogeneous materials. Interdisciplinary applied mathematics 16, Springer, New York.
Tscheschel, A. and Stoyan, D., 2006. Statistical reconstruction of random point patterns. Computational & Data Analysis 51, 859-871.