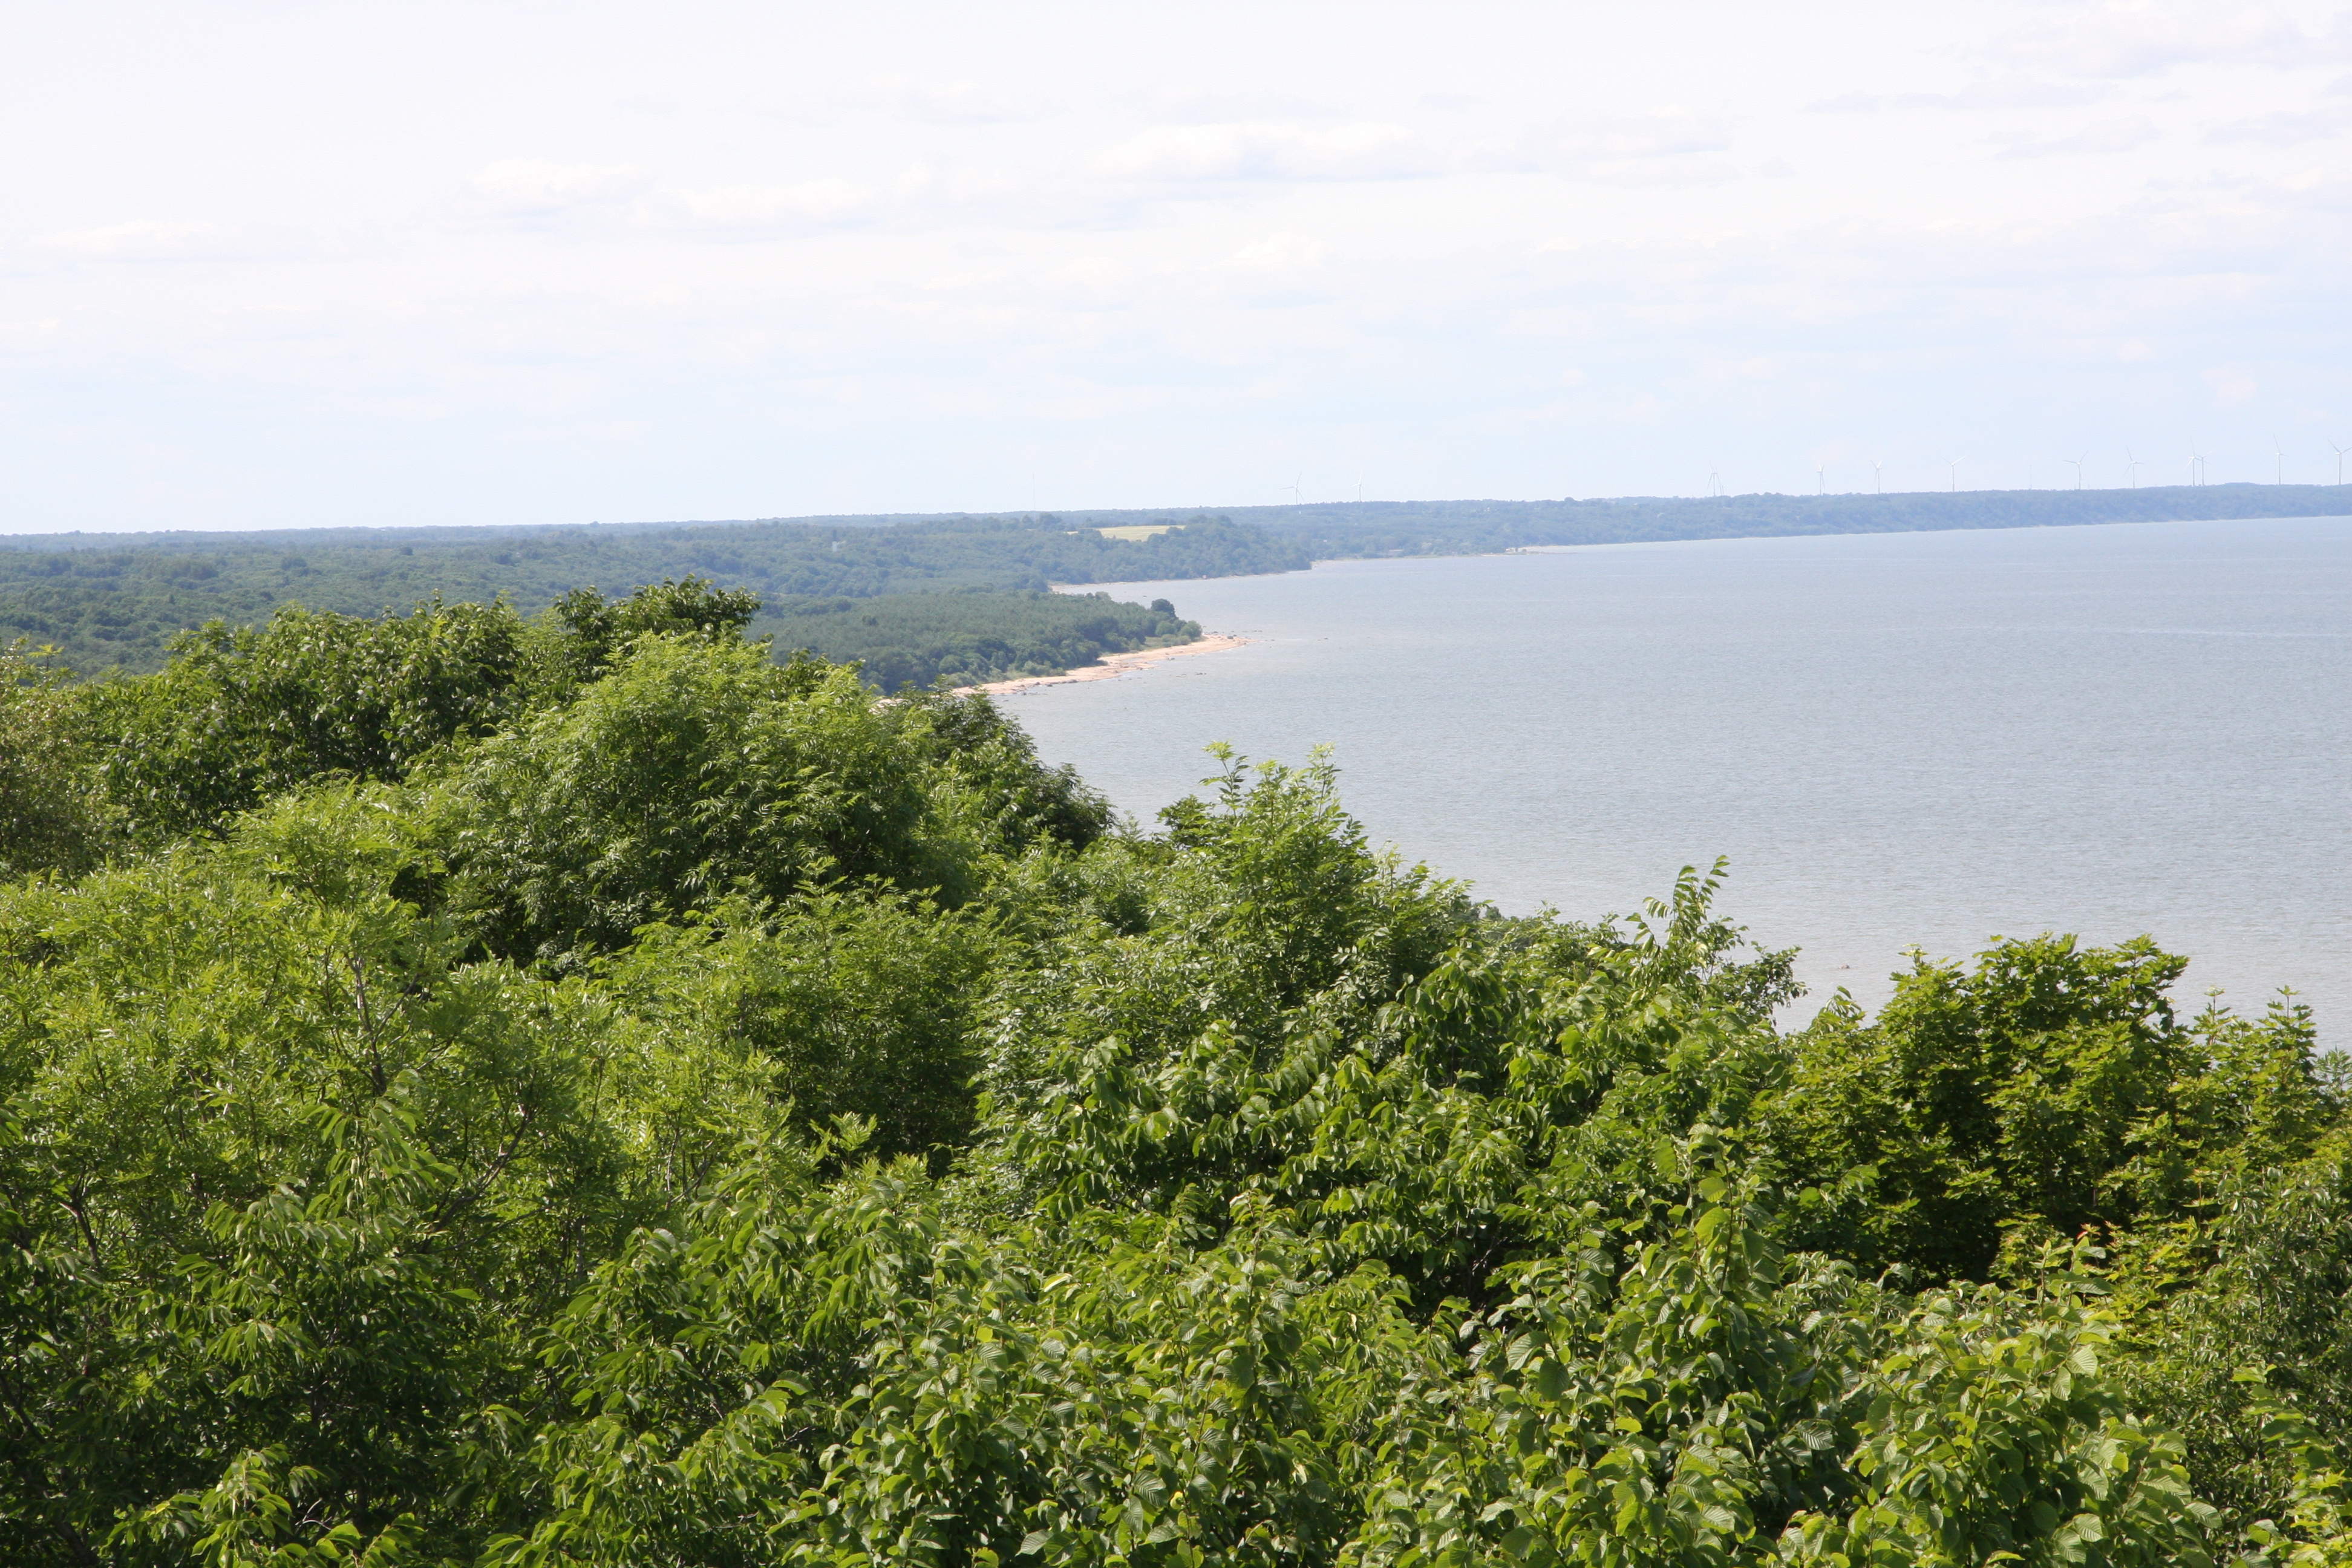
Today I am going to take you on a journey, the journey of mathematical forestry, which is also a bit of my own journey. When state-organised forestry was set up in different parts of Europe around 1750 the pioneers in this new subject area must have looked at vast areas of partly untouched (similar to the coastal forests in Northern Estonia near Narva shown in the photo below) and partly devastated forest land and were puzzled by the trees they looked at. What kind of story were they telling? Even after collecting some data things would not immediately improve when they looked at lengthy columns of data. Can’t see the wood for the trees. Can’t see the story behind the data. This was the point where statistics came in, not to torture students, but to make sense of data. Of course, at that time statistics only began its own journey.
In his textbook on forest mensuration Kilkki (1989) described the forest ecosystem as an object system and how different systems and processes eventually lead to a decision system. In the mensuration system, it is defined what to measure and how. The data are then statistically processed in the computing system. The computed summary characteristics are processed in the planning system and the planning system leads to decisions and feed back into the object system, i.e. the forest ecosystem.
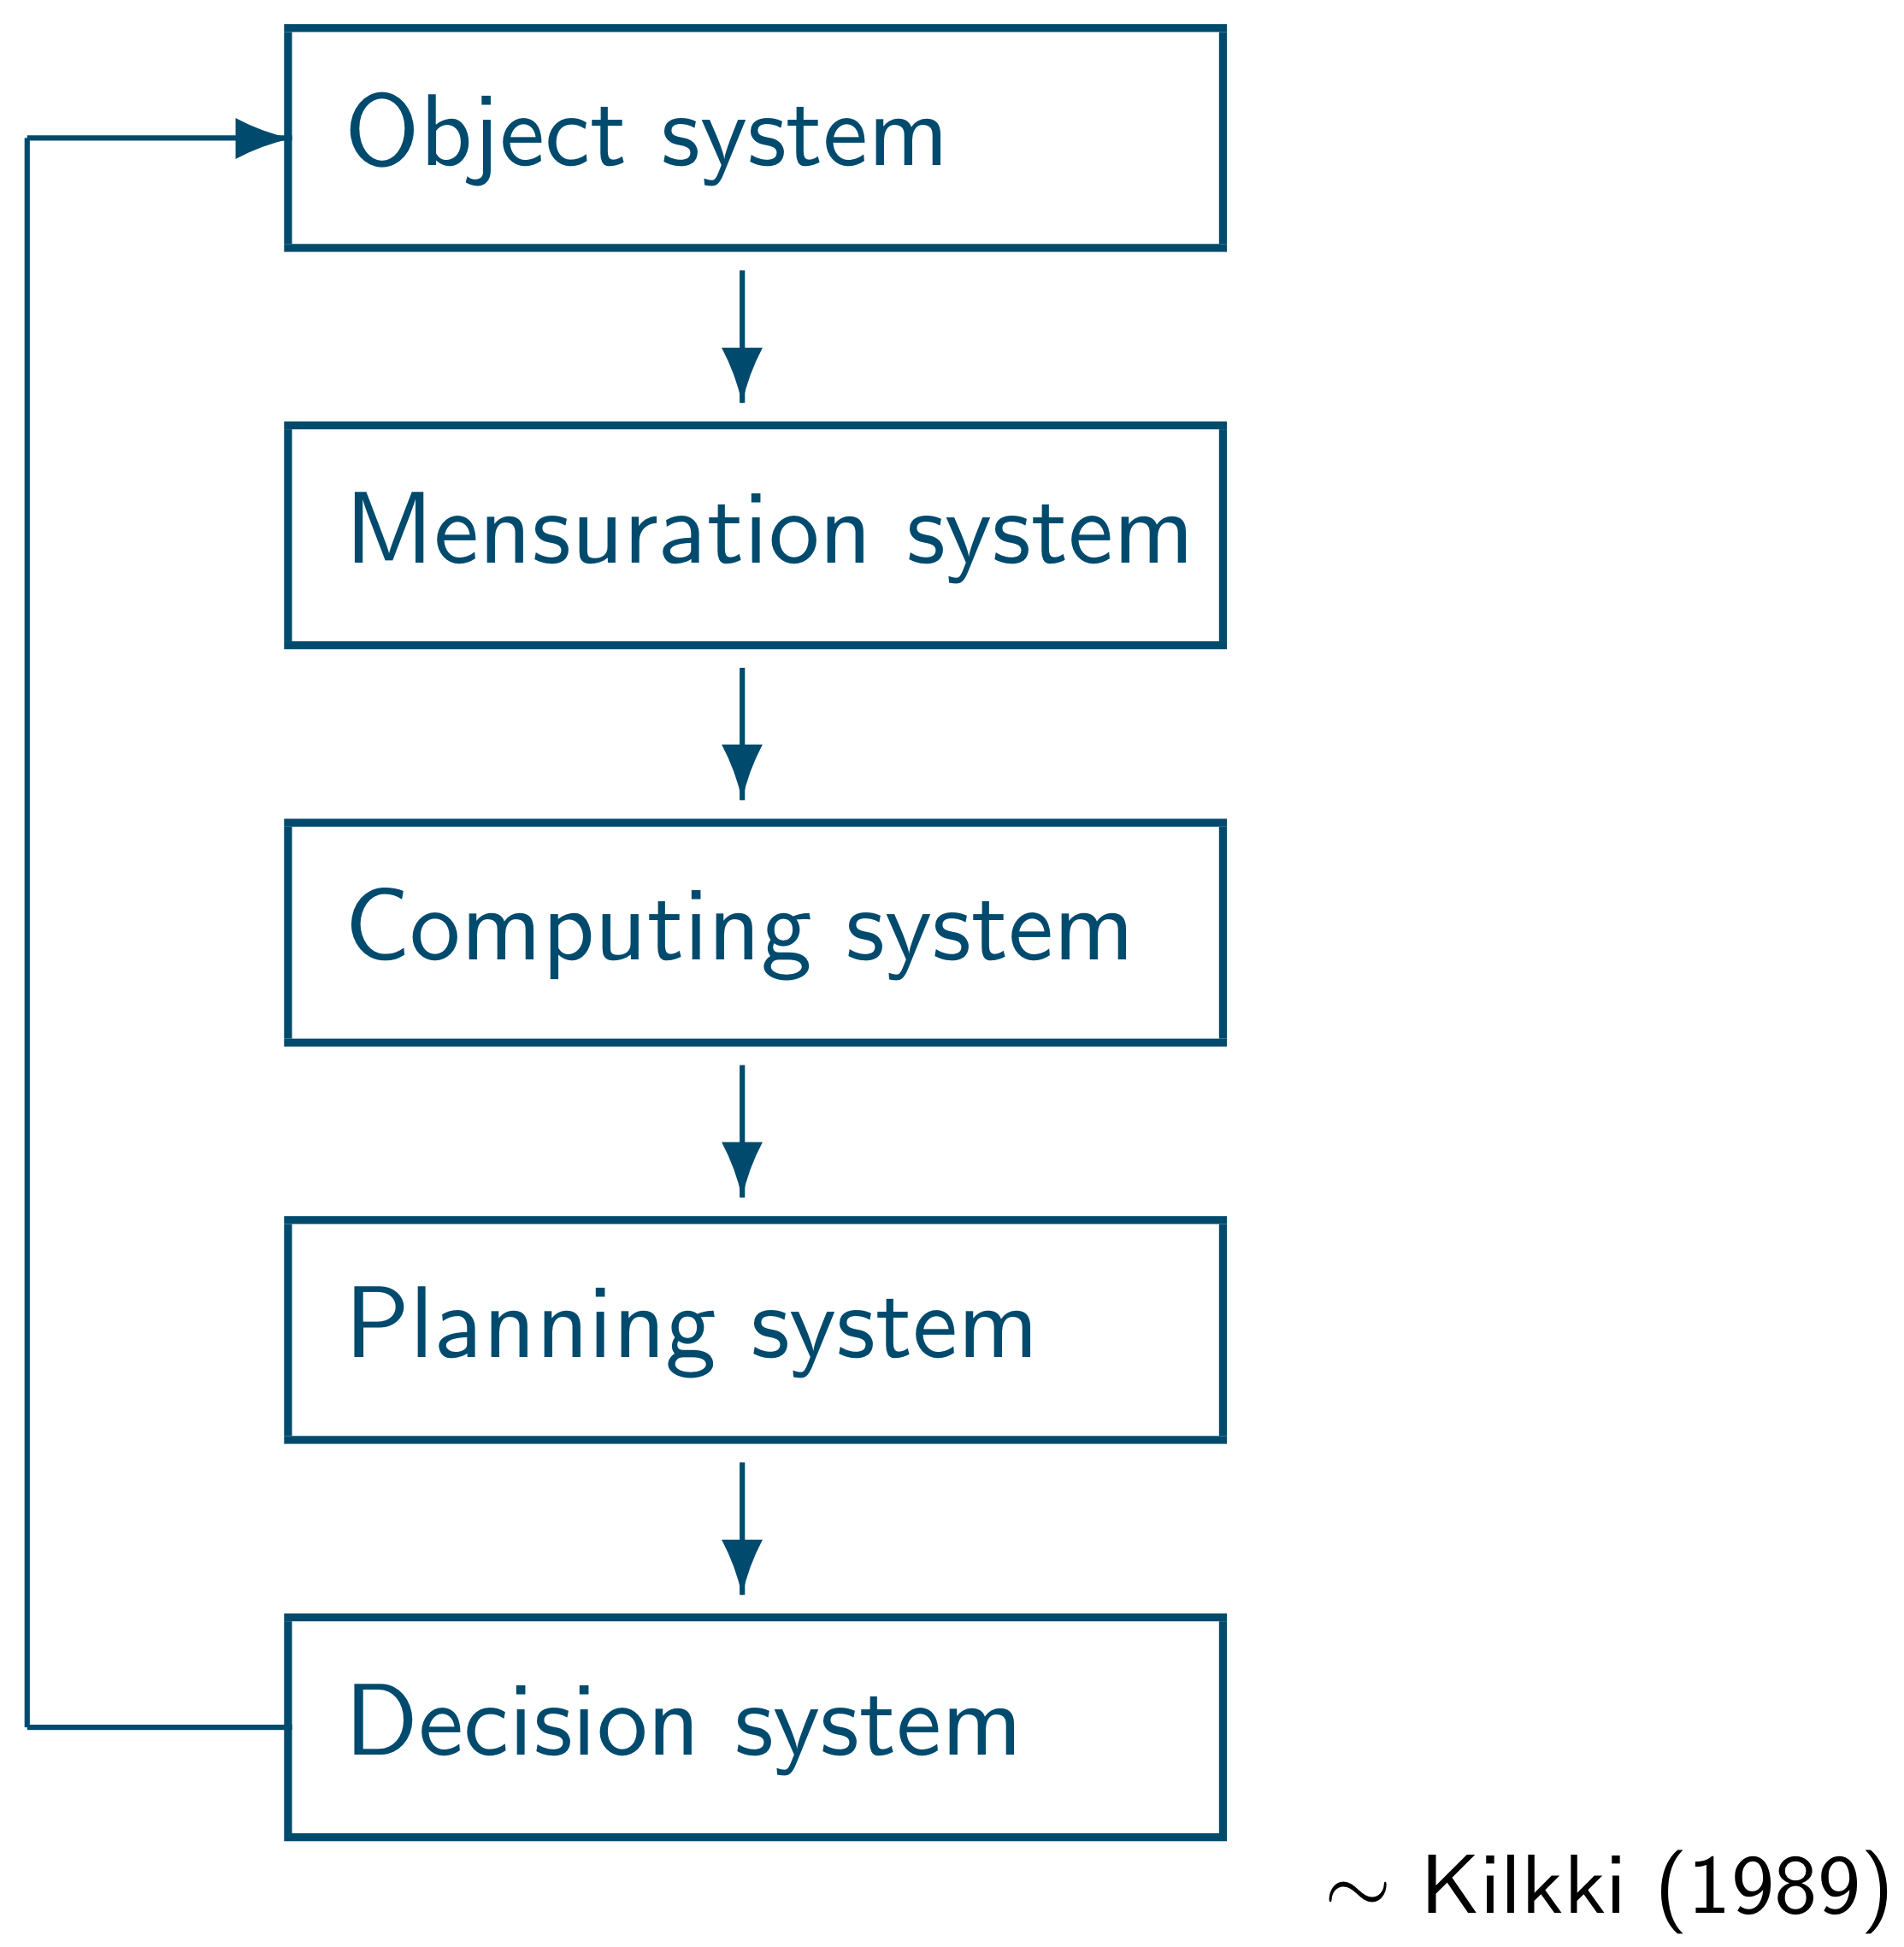
The early pioneers in forest science assigned professorships to these boxes, e.g. a professor in forest mensuration, a professor in forest inventory, in forest biometrics and in forest planning.
The development of general statistics happened approximately at the same time as the development of forest mathematics. General statistics often was influenced by applications, for example in agriculture. The work of W. S. Gosset (student) and R. A. Fisher was often inspired by some of their practical applications in agriculture.
Already in 1729 J. F. Penther published Praxis geometriae, a book on the surveying of forest areas. Around 1766 J. E. Vierenklee and C. C. Oettelt published textbooks on mathematics for foresters and forest mensuration. Something remarkable was achieved when J. C. Paulsen in 1795 published the first yield tables ever, i.e. models of biological production long before modelling started in biological science. In 1835 G. König published his famous book on forest mathematics that was published into many languages. University chairs in forest biometrics were only set up much later towards the 1960s till 1980s.
There are many different names for the academic subject area of forest biometrics. These include numerical forestry, quantitative forestry, forest statistics, computational forestry and others. At Umeå my Chair is referred to as mathematical statistics applied to forest sciences. All of these professorships accomplish similar things, which can be described as the “study of mathematical-statistical methods for effectively describing and modelling patterns and processes in forest science”. For me it is important that forest biometrics belongs to the realm of basic sciences and is a strong research area. Forest biometricians are mediators between mathematical statistics and forest science. And forest science as our application has also the potential of inspiring the development of general mathematical statistics.
Professors have specific lifetimes and their academic subject areas have lifetimes, too. Traditional subject areas may change over time, some vanish and new ones come into existence. Silviculture and forest economics have for example a long tradition, whilst soil science and forest ecology are comparatively young subject areas.
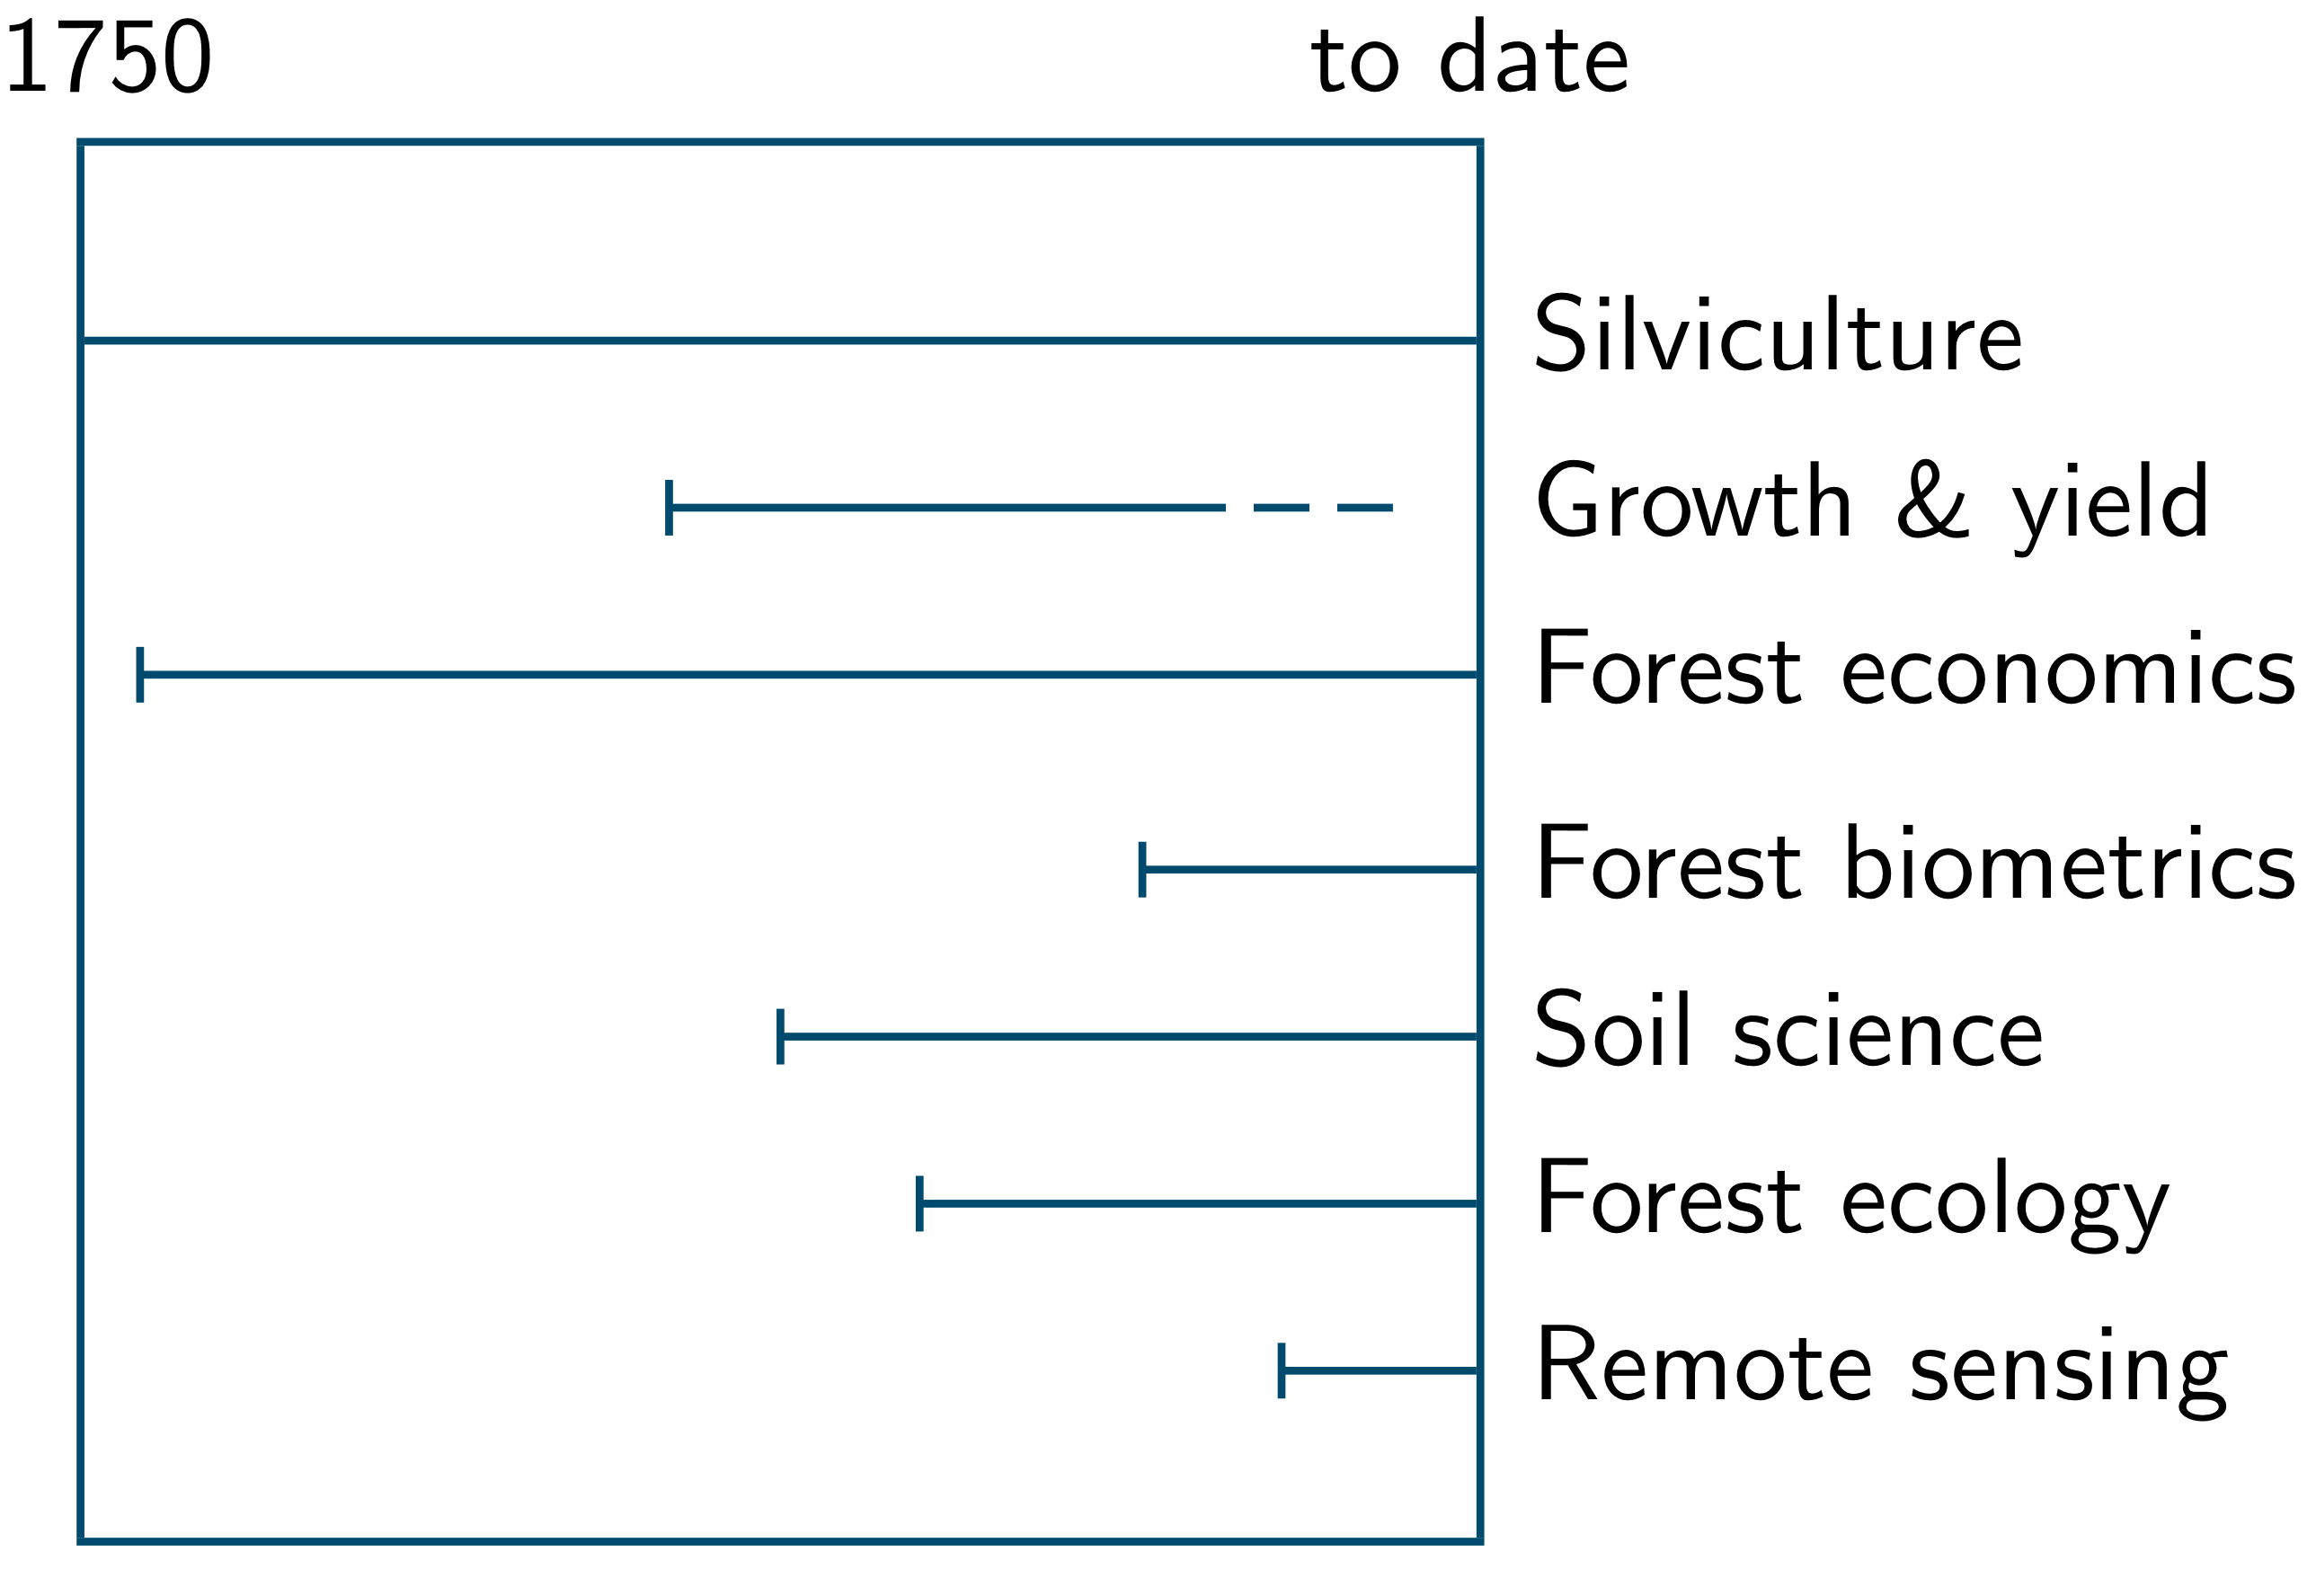
Forest biometrics is a quite young subject area and there is still a lot to expect from this field of forest science.
Mathematics is about patterns, natural sciences, too. Often mathematical patterns and patterns in natural sciences come together. In the Fibonacci sequence of numbers any subsequent number is the sum of the two previous ones. In some trees, the horizontal layering of branches is organised according to the Fibonacci sequence of numbers. This sequence of numbers is also related to another pattern, the golden section, which plays an important role both in mathematics and in biology.
The job of a professor is not only a job, it is something special, a vocation and a quest. In the same way the research topics we are dealing with should be something that intrigues us so much that we cannot simply let the important questions go. In a way they keep us awake at night. What are the topics that have kept me awake? There are certainly three that have kept me busy in the past years, i.e. woodland structure analysis & modelling, the biometry of plant growth and human behaviour in forests. There are a few things that link these three topics, one of them is space.
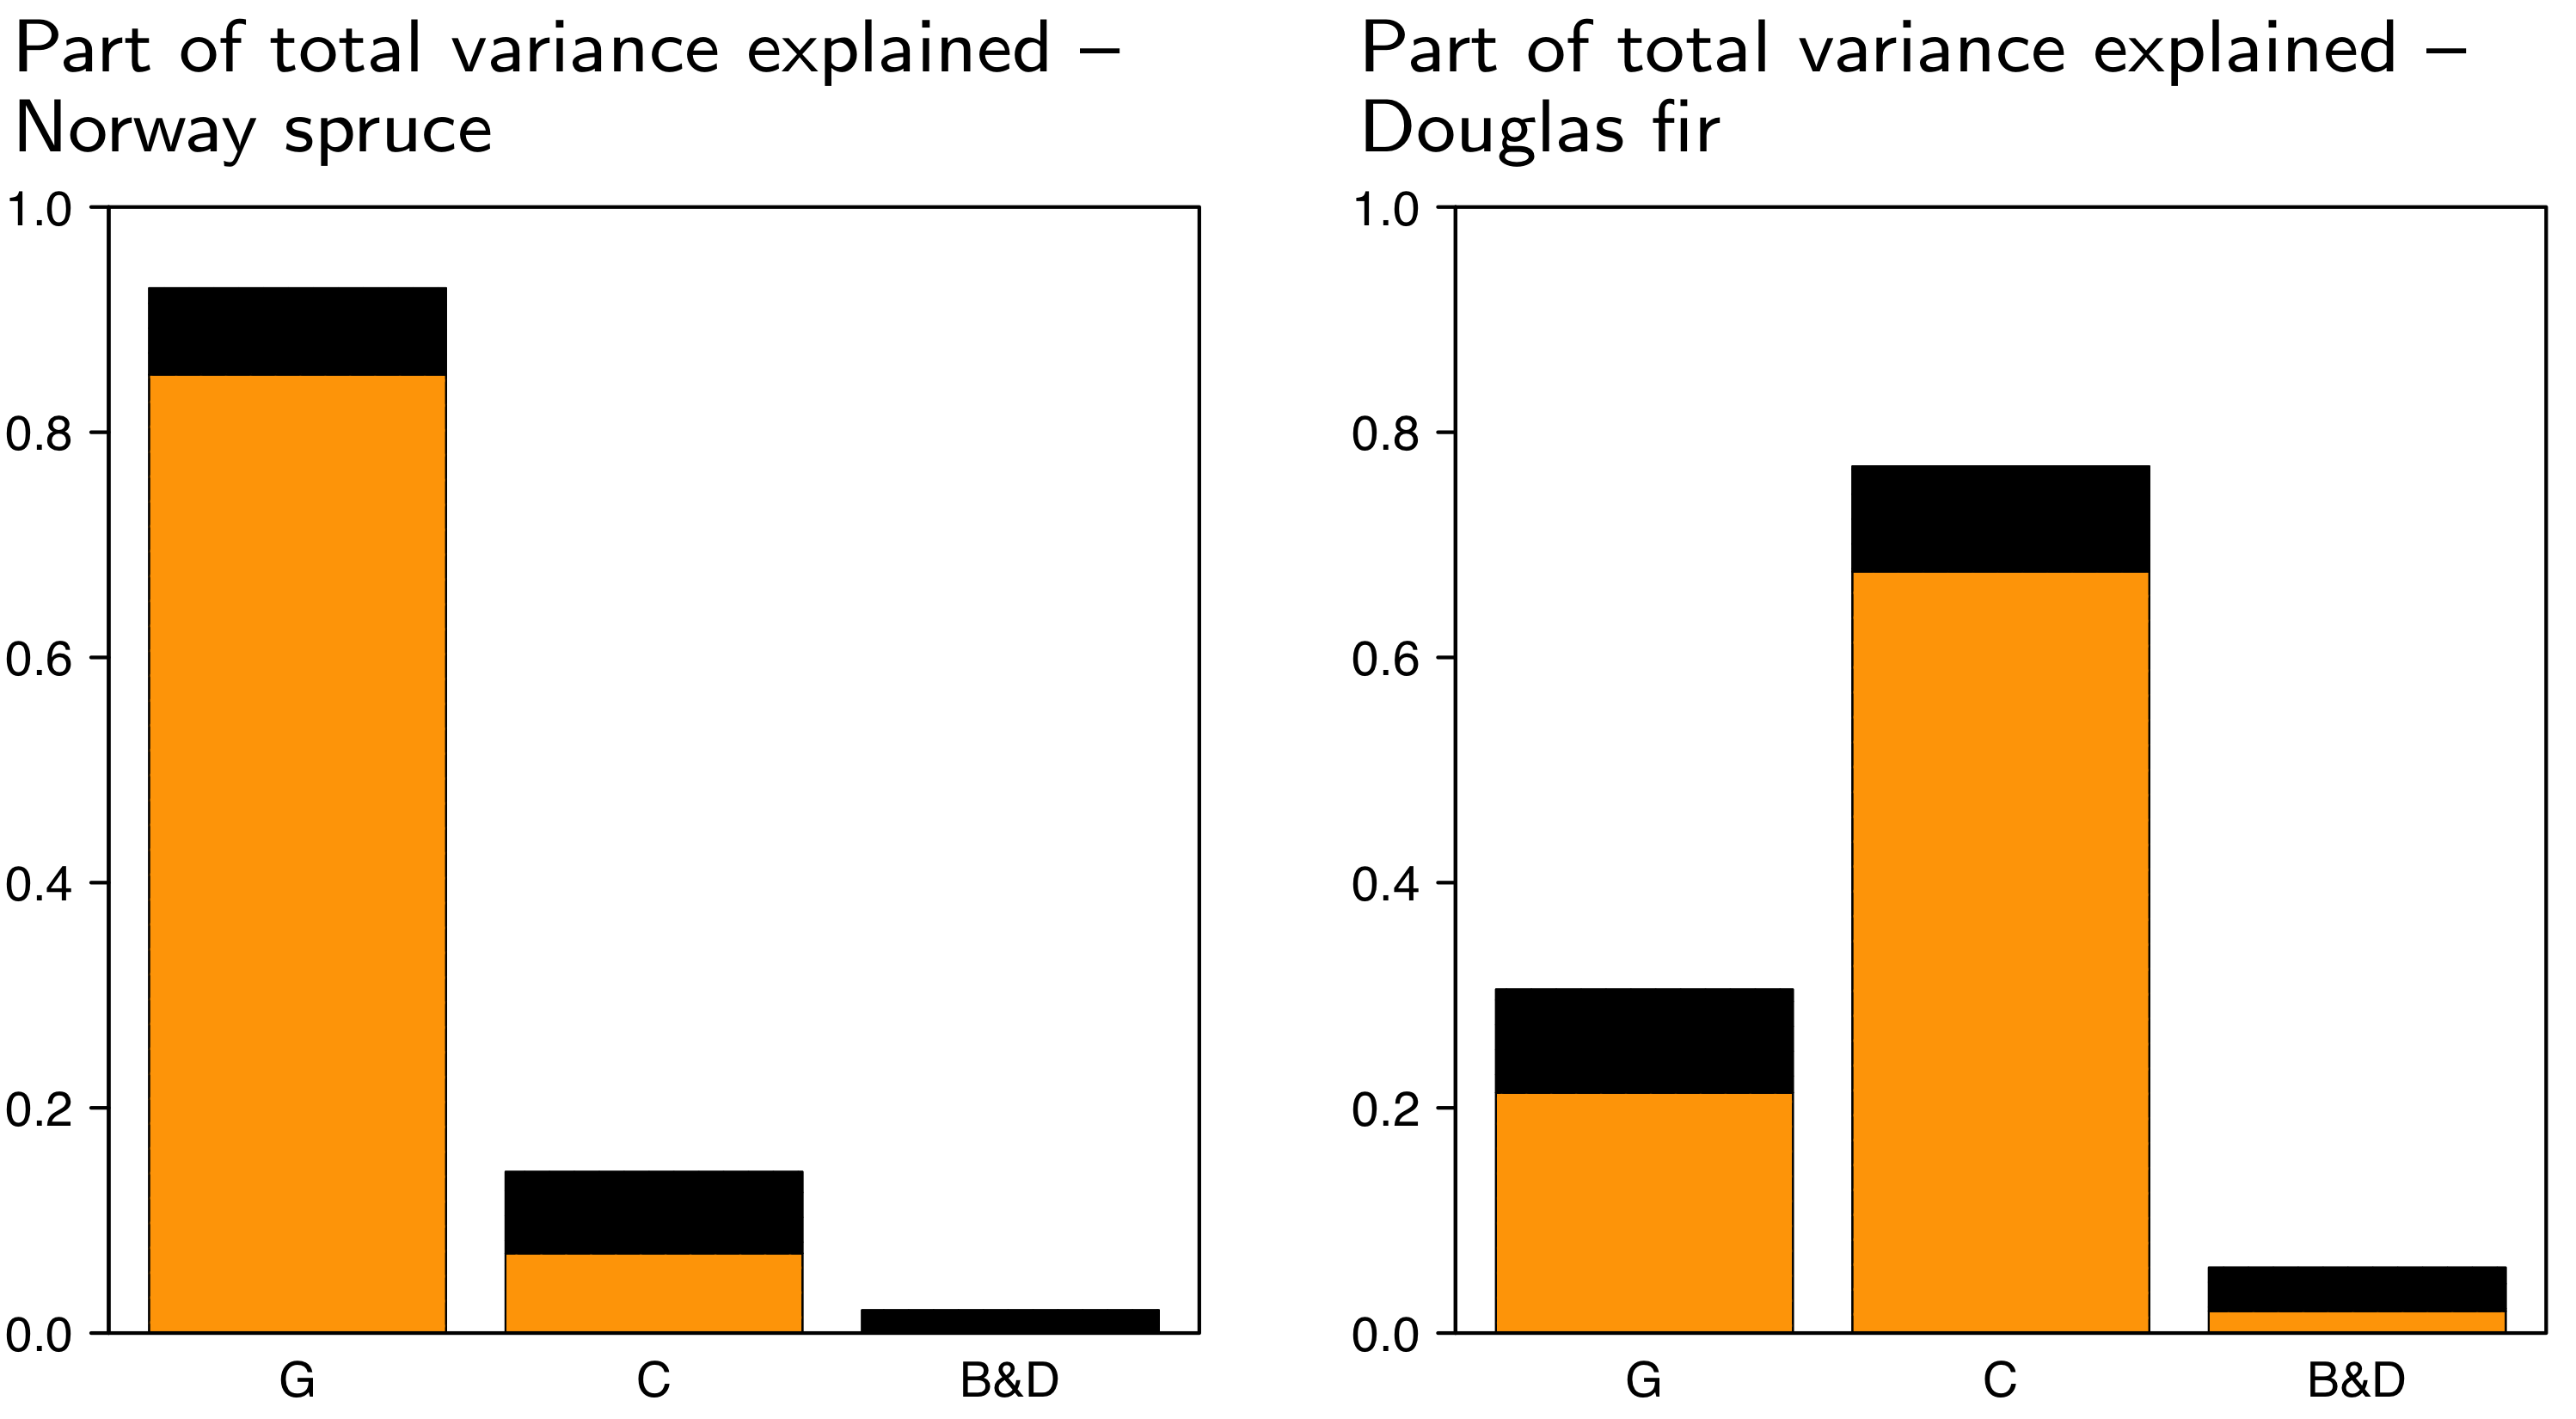
Two examples. A couple of years ago I wondered what might be the most important macro-processes influencing the formation of spatial patterns. Growth (G) is for example a very important process and recently evidence has been found suggesting that trees always need to grow at least a little for their survival. Interaction is another important process and the most prominent representative of tree interactions is competition (C). Then there are birth and death processes (B&D) where trees are either added to or deleted from the point pattern formed by the tree locations. Initially I believed the combined birth and death process would have the greatest influence on the formation of spatial patterns.
We developed an individual-based model two forest time series. The model was inspired by spatial statistics and is good at representing spatial tree interactions. Each of the three macro-processes was represented by three model parameters. We then applied a sensitivity analysis to study the variance of mark variograms, i.e. the model input, in terms of systematic variations of the nine input parameters. To this end we used a global sensitivity measure, the extended Fourier Amplitude Sensitivity Test. The results have shown us that birth- and death processes are of minor importance compared to growth and competition. We also learned that the importance of processes depend on the development stage of a forest. In the graph below (from Pommerening et al., 2011) the results are shown for a young Norway-spruce forest in Austria and for a natural Douglas-fir forest in British Columbia.
A quite different example is the behaviour of professional humans in forests. Forestry professionals select trees for a number of reasons, e.g. as Christmas trees, as habitat trees and in thinnings (to evict them from the forest for the benefit of others). A master student of mine has recently studied how much agreement there is among forestry professionals when it comes to tree selection. In the past it was always believed that forestry staff select trees exactly according to silvicultural guidelines. Therefore tree selection in forest simulators have been modelled quite deterministically.
My student studied the behaviour of test persons in twelve different forests throughout Great Britain from Northern Scotland to Cornwall. The test persons were asked to mark trees for two different thinning strategies, i.e. thinning from below and crown thinning. The latter technique is now often discussed in conjunction with continuous cover forestry (CCF). For assessing agreement we used Fleiss’ [latex]\kappa [/latex], a measure that is often applied in medicine and particularly in psychology. The values of this measure usually range between 0 and 1, 0 indicating chance agreement and 1 denoting perfect agreement.
It turned out that the overall agreement was low with maximum values of [latex]\kappa [/latex] of around 0.5. The agreement was consistently and markedly higher in low thinnings than in crown thinnings. This was somewhat unexpected as crown thinnings usually come with a didactic element that narrows down the choice of trees. We tried to understand this outcome and it turned out that low thinnings have a long tradition in Britain and many professionals are used to it while crown thinnings are somewhat new. New techniques initially often create confusion and confusion leads to low levels of agreement.
This type of work in forest biometrics requires interdisciplinary teams and a necessary pre-requisite for recruiting such teams is a solid education in quantitative methods, particularly in statistics. Often we enter discussions at faculties about new module structures and the number of hours. Of course, all subject areas are important. Still at the end of the day, all research boils down to some numbers that we need to make sense of and we end up in a similar situation as the pioneers of forest science.
(Abbreviated inaugurational lecture on 13 May 2016)